
On the 18th of January, the Chinese government published the quarterly economic data for the fourth quarter of 2020, which concludes the economic year of 2020. After the first quarterly decrease of GDP in Q1 since 1978, and the subsequent recovery of the Chinese economy Q2 and Q3, the economic data showed a continued trend of recovery with an increase in year-on-year GDP by 6.5% for Q4 of 2020.
Taking into consideration the abovementioned results, China would be the only major economy globally with annual GDP growth, namely an increase of 2.3% for 2020 compared to the past year. Other major economic powers, including the US and Europe, continue to face the consequences of the spread of COVID-19.
Despite these positive indications from the economic data, local resurgences of COVID-19 in China present a new challenge and a changing global political landscape will similarly poses both opportunities and challenges. Below we highlight the most important takeaways of the economic data which has just been released and take an in-depth look at the year 2020 in review.
China’s GDP growth returns to pre-COVID levels in Q4 and exceeds 100 trillion yuan for 2020
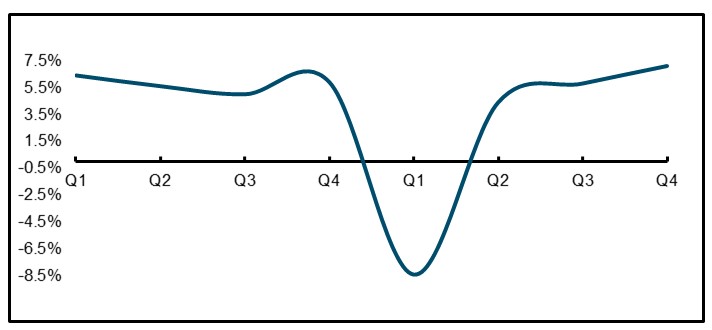
In the fourth quarter, China’s economy saw a y-o-y increase in GDP of +6.5%. This displayed continued economic recovery compared to the contraction of Q1 (-6.8% y-o-y) as well as further economic expansion compared to Q2 and Q3 (see graph below). In addition, the quarter-to-quarter GDP growth was positive at +0.5%, and reflects well the efforts of the Chinese government to stimulate its economy.
Graph 1. Quarterly GDP 2019-2020
Furthermore, according to the data by the National Bureau of Statistics (NBS), China’s annual GDP increased by 2.3% in 2020. Considering the early impact of the outbreak of COVID-19 this remains a remarkable economic recovery and as a consequence the country’s annual gross domestic product exceeded 100 trillion yuan for the first time.
Despite these positive developments, we must note that the year 2020 marks the worst GDP growth rate since 1976. Here the COVID-19 outbreak mainly impacted consumption, where the contribution of consumption to GDP growth was approximately half of regular Q3 levels, as evidenced by the retail sales data highlighted below.
Imports and Exports see expansion once again
In Q4, the total value of imports and exports of goods increased by +4.8% y-o-y, which was lower compared to the +7.3% y-o-y increase reported following Q3. Nevertheless, the data shows a strong improvement compared to the decrease of total imports and exports reported in Q1.
In 2020, the total aggregate value of imports and exports of goods expanded by +1.55% y-o-y. the value of exports had risen by +4% y-o-y, whereas the value of imports was down 0.7% y-o-y respectively by the end of December.
Continued stability in employment rate throughout the end of 2020
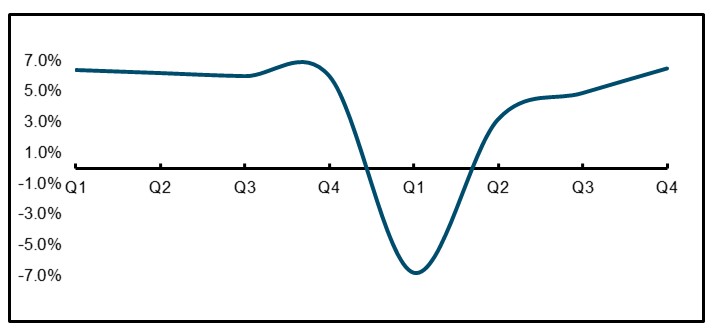
The unemployment rate in Q4 in urban areas returned to the same level as in the last quarter of 2019, namely 5.2% (see graph below). This not only implies a return to the pre-COVID level of unemployment but also meant the target set out prior to the start of the year at 6% was met.
Graph 2. Unemployment rate in 2020
In 2020, a total of 11.86 million people found employment, by which the target set by the Communist Party in the previous year of supporting 9 million people to find employment was successfully achieved. Although data on the developments for rural employment (-1.8%) and the employment of migrant workers (-2.7%) were released showed negative trends, it remains unclear whether these figures accurate represent the actual situation as the majority of migrant workers are unregistered.
Purchasing Managers’ Index (PMI) continues to rise in Q4
The composite PMI output index for large enterprises is a weighted summation of the manufacturing output index and non-manufacturing business activity index. If the PMI index is 50 this indicates no change, whereas a number over 50 indicates improvement and a number below 50 suggests a decline.
After the Composite PMI for large enterprises reached 55.1 in September, its upward trend continued throughout the third quarter with a PMI of 55.3 in October, 55.7 in November and 55.1 in December. In line with the previous quarter, the upward trend can mainly be attributed to the non-manufacturing PMI, which in turn can be explained by the heavy impact of COVID-19 on the services sector at the start of the year.
After exceeding the PMI threshold of 50 in Q2 and Q3, the composite PMI for SMEs continued to rise to 55.7 in October and 57.5 in November, prior to a slower improvement in December of 55.8. Notably, the composite PMI for November is a ten-year high.
Total retail sales on the rise in Q3 and Q4
After a positive y-o-y growth of retails sales in Q3, retail sales increased by an impressive 4.6% in Q4 y-o-y, and an increase of greater than 4% compared to the previous quarter. The growth of retail sales was particularly noteworthy in the month of December, with an increase of 1.24% m-o-m.
In line with the previous quarters, the main driver of growth has been online retail sales, which grew by +10.9% y-o-y, accounting for one fourth of the total retail sales of costumer goods. This number was up 14.8% in Q4 compared to Q3.
The total retail sales of consumer goods in 2020 reported were 39.200 billion yuan, which is a decrease of approximately 4% when compared to the official data from 2019. The sales in urban areas were more heavily impacted by the outbreak of COVID-19 than sales in rural areas, and as such this decrease was a major contributor to the annual decrease of retail sales.
Year-to-date Industrial Production steadily expanding in Q4
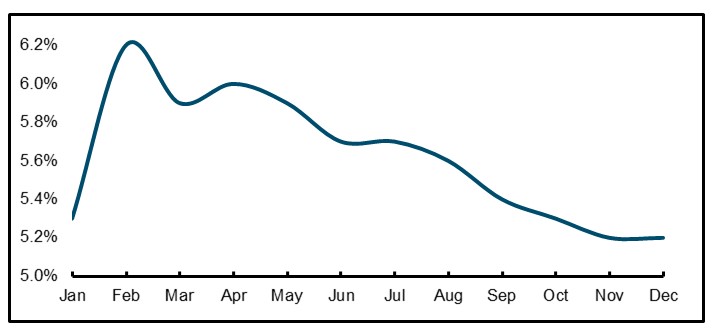
The industrial growth rate, which is calculated as the value added of industrial enterprises, was +7.1% y-o-y in Q4. Despite a contraction of the industrial growth rate by -1.3% in the first half year (y-o-y), the industrial growth rate for the year 2020 as a whole stood positive at +2.8% (see graph below).
Graph 3. Industrial Production 2019-2020